trading-education | 22-01-26
Order flow analysis is a method of tracking the real-time aggression of buyers and sellers. It focuses on the actual executed volume rather than just price action. Professional traders use this to validate moves and find 'trapped' traders. While standard charts show you where the price has been, order flow shows you why it is moving. This precision allows for better timing and clearer entry signals.
- Mechanism: It dissects the "tape" (Time & Sales) and Depth of Market (DOM) to visualize exactly how many aggressive market orders are consuming passive limit orders at specific price levels.
- Critical Risk: The "Liquidity Trap." Beginners often mistake large limit orders on the DOM for genuine support, falling victim to "spoofing" where institutional algorithms pull these orders milliseconds before execution, causing slippage and immediate losses.
- Strategic Verdict: This is the only form of analysis that reveals why price is moving. It is essential for scalping and intraday positioning but requires high-speed data feeds and significant screen time to master.
Introduction
If you have ever bought a breakout that immediately reversed and stopped you out, you have likely been the victim of order flow mechanics. Order flow analysis is the study of the interaction between liquidity providers (passive limit orders) and liquidity takers (aggressive market orders).
While traditional technical analysis looks at historical footprints—where price was—order flow analysis shows you the market's intent and aggression right now. In my past few years on trading desks, I have learned that the "chart" is often just a map of the past, whereas the order flow is the engine driving the future.
In this guide, I will deconstruct how to read this engine using tools like the Footprint Chart, interpret Cumulative Delta, and avoid the common traps that drain retail accounts.
What Is Order Flow Analysis?
Order flow analysis is the study of real-time buyer and seller aggression through the interaction of market orders and limit orders. Unlike technical analysis, which uses historical price, order flow utilizes tools like Footprint Charts and the Depth of Market (DOM) to visualize the auction process, identifying "absorption" and "liquidity traps" before they manifest on a standard candlestick chart.
- Primary Tool: Footprint Charts and Depth of Market (DOM).
- Best For: Scalping and verifying breakout entries.
- Key Metric: Cumulative Volume Delta.
The most common misconception I see among beginners is the belief that price moves because there are "more buyers than sellers." This is technically impossible; for every contract bought, one must be sold. Price moves because one side is more aggressive.
When I look at a market moving up, I am not looking for "more buyers." I am looking for buyers who are willing to "lift the offer" (buy at the asking price) aggressively enough to consume all the passive sellers sitting on the limit order book. If that aggression isn't there, the price will not hold, regardless of what a moving average says.
Essential Tools for Order Flow Analysis
To see this activity, I cannot rely on standard candlesticks. I use specific visualization tools that render the data inside the candle.
Order Flow Tool Comparison Matrix (2026 Standards)
| Tool | Visibility | Primary Signal | 2026 Complexity |
|---|---|---|---|
| Footprint | Executed Aggression | Imbalances / Trapped Traders | High (Requires MBO) |
| DOM | Passive Liquidity | Spoofing / Icebergs | Extreme (Mental Fatigue) |
| Delta | Net Aggression | Exhaustion / Divergence | Medium (Best for Reversals) |
For the Footprint Chart Section example
https://www.quantower.com/blog/imbalance-footprint-chart-and-rithmic-plugin
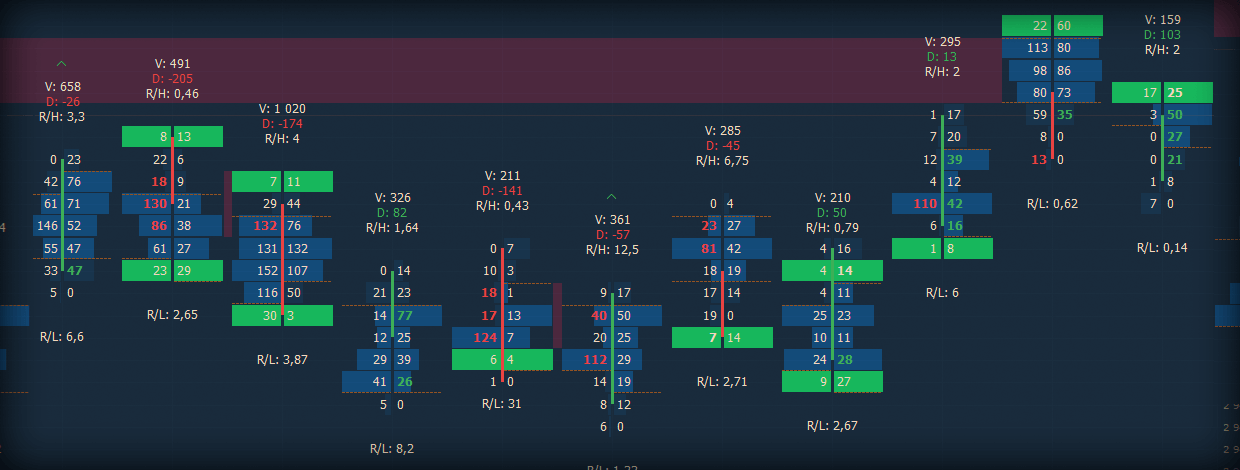
1. The Footprint Chart: Visualizing the Auction
A Footprint Chart (or Cluster Chart) is a multi-dimensional visualization tool that displays the executed volume at the bid and ask for every price level within a single bar. It reveals Bid-Ask Imbalances and Unfinished Business, allowing traders to identify exactly where aggressive participants are entering the market and where "trapped" liquidity is likely to trigger a reversal.
For example, if I see zero volume traded at the very top of a green candle, it tells me there is 'unfinished business.' The market is likely to revisit that level to complete the auction.
For the Depth of Market (DOM) Section example
https://www.jigsawtrading.com/trading-software/
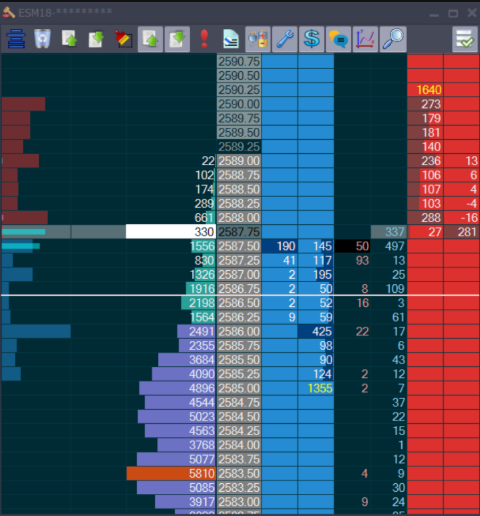
2. The Depth of Market (DOM)
The Depth of Market (DOM) displays the limit orders waiting to be filled, often referred to as the "Price Ladder." In 2026, the DOM is used to detect "Spoofing" and "Absorption." Professional traders use MBO data on the DOM to verify the "Queue Position" of their orders, ensuring they are filled before the liquidity "paints" and disappears.
Pro Tip: Context matters. In the S&P 500 E-mini (ES), a 'large' order on the DOM is typically considered 100+ contracts during the US session. Anything showing <10 contracts is usually just retail noise. Knowing the difference prevents you from reacting to insignificant orders.
3. Volume Profile
While the Footprint shows me the "now," the Volume Profile shows me the "context." It displays the total volume traded at each price level over the entire session. I use this to identify the Point of Control (POC)—the price level with the highest volume. This acts as a magnet; trading away from the POC is often a low-probability "chop," while trading back toward it offers higher conviction.
Aggressive Delta & Contract Tick Value Logic
Understanding how "Aggressive Delta" impacts your account requires knowing the tick value of your specific contract. High Delta in a "Thin" market moves price much faster than in a "Thick" market.
How Does Delta Divergence Work?
Delta divergence works by comparing the direction of price movement with the net aggression of buyers and sellers; if price makes a new high but Delta makes a lower high, it signals that the buyers are exhausted. This is one of the most reliable reversal signals I use.
How to Spot Delta Divergence (Step-by-Step): Delta divergence is a reversal signal that occurs when the price makes a new high, but aggressive buying volume decreases.
- Identify the High: Wait for price to push to a new daily high (e.g., ES at 4500).
- Check Cumulative Delta: Look at the Delta pane. If the Delta line fails to make a new high while the price does, divergence is confirmed.
- Confirm Absorption: Watch the Footprint chart for high volume at the top of the candle with zero price progress.
- Execute Short: Enter on the break of the previous candle's low.
Expert Insight:
When configuring my delta divergence indicator settings, I don't look for minor discrepancies. I look for massive anomalies. If the price grinds up 10 points but Delta is flat or negative, that is the "smoking gun." I treat this as a bluff. The market is trying to lure in late buyers before "puking" (a rapid sell-off).
Operational Reality: The "Traps" of the Trade
Key Specs:
- Trap Frequency: High in low-liquidity environments (e.g., pre-market, lunch hour).
- Key Pattern: Absorption (High volume, zero price displacement).
- Cost: "Tick" slippage is common if using market orders in thin books.
In the reality of a trading desk, we don't use formal academic language. We use slang that describes the violence of the auction.
- "Lifting the Offer": This means aggressive buying. If I say, "Gold is ripping, they are lifting the offer at 2050," it means buyers are frantically hitting market buy orders.
- "Sweeping the Book": This is when a large order consumes liquidity across multiple price levels in one go. It usually leaves a "thin" area on the chart that the price will likely retest.
The Absorption Trap
A critical order flow absorption trading strategy involves spotting when an immovable object meets an unstoppable force.
I often see a massive amount of aggressive selling hitting the bid—thousands of contracts sold—yet the price does not tick down. This is absorption. A large passive buyer (an "iceberg" order) is soaking up all the selling pressure. Once the sellers realize the floor isn't breaking, they panic and cover their shorts, driving the price up.
Voice of the Trader:
“The tape doesn't lie, but it moves fast. Verified users often report that the hardest part isn't reading the numbers; it's the mental fatigue of watching the DOM for hours. You can be right about the direction but get shaken out by a stop-run in seconds.”
Common Mistakes vs. Professional Fixes
This table outlines the specific failure points identified in forensic research regarding order flow usage.
Why Do Professionals Rely on This Data?
Professionals rely on order flow data because it is the only risk management tool that quantifies "conviction" rather than just price history.
When I enter a trade, I am not guessing if support will hold; I am watching the orders hit that support level live. If I see selling dry up (volume decreases) and buyers step in (lifting the offer), I have objective proof to stay in the trade.
The Catch:
The friction point here, as noted in the research, is Analysis Paralysis. The data feed is incredibly fast. You will see thousands of numbers flashing per minute. If you try to analyze every single tick, you will freeze. Professional traders filter this noise by focusing only on key areas—like the Volume Profile Point of Control (POC) or the daily High/Low.
Expert Insight: Mastering the "Unrealized Trap"
The "Unrealized Trap" in order flow occurs when a trader sees a high Delta spike and stays in a trade, only for the price to "Absorb" that volume and reverse. In 2026, this is identified by watching MBO "Iceberg" orders; if aggressive Delta hits a price level and the price refuses to move, an institutional buyer is "Absorbing" the move, and a reversal is imminent.
Final Thoughts
Order flow analysis is the closest you can get to X-ray vision in the markets. It moves you from a game of "guessing patterns" to a business of "reading intent."
However, it demands respect. The speed of the data can lead to over-trading and emotional burnout if you do not have rigid rules. Start by mastering one element—like the Footprint Chart or Cumulative Delta—and observing how price reacts at key levels. Do not try to read the entire tape at once.
FAQs
Order flow is calculated by measuring Volume Delta, which is the net difference between aggressive market buy orders executed at the Ask and aggressive sell orders executed at the Bid. Unlike standard price analysis, this method dissects Time & Sales data to visualize real-time participant aggression, typically represented through Footprint Charts or Cumulative Delta indicators. Accurate calculation relies on high-speed Level 2 data and is essential for determining whether buyers or sellers control the immediate auction.
The most effective indicators for order flow are the Footprint Chart and Cumulative Volume Delta (CVD). The Footprint Chart visualizes executed volume at specific price ticks to reveal "imbalances" and "absorption," while CVD tracks the net aggression of buyers versus sellers to identify trend exhaustion. Which tool you prioritize depends on whether you require granular tick-level entry precision or broader confirmation of market direction.
Order flow trading is profitable for experienced traders who leverage market microstructure to identify institutional buying and selling pressure before price moves. This method provides a distinct advantage over lagging technical analysis by revealing liquidity absorption and precise entry levels within the order book. Profitability, however, is contingent on access to low-latency Level 2 data and is best suited for high-frequency scalpers rather than passive investors.
Order flow analysis is primarily used by proprietary trading firms, institutional desks, and professional retail scalpers who require immediate validation of market sentiment. These participants rely on Level 2 data and Depth of Market (DOM) tools to visualize institutional liquidity and absorption, enabling them to react to aggressive buying or selling before it reflects on standard price charts. Consequently, this methodology is essential for high-frequency, short-term strategies rather than long-term investing.
Related Blogs

trading-education | 22-08-25
What is a Funded Trading Account? - Detailed Guide
A funded trading account is a financial arrangement where a proprietary trading firm (like Apex) provides you with virtual or...
Read more
trading-education | 23-08-25
How Do Funded Trading Accounts Work?
A funded trading account works by granting a trader access to a firm's capital after they pass a simulated evaluation....
Read more
trading-education | 25-08-25
How to Get Funds for Trading? - 6 Practical Ways
Starting a trading journey often requires more than knowledge—it requires capital. Yet many aspiring traders face the same challenge: how...
Read more